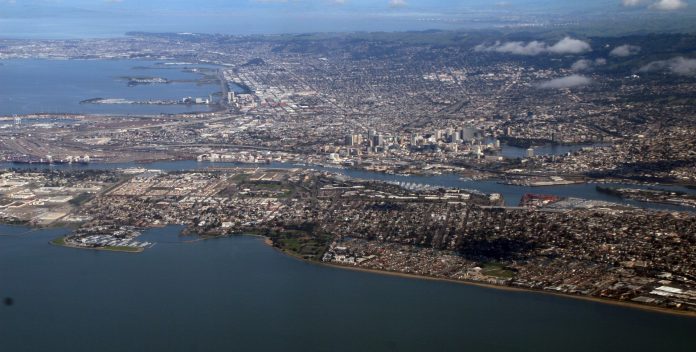
More than just mapping our streets, the Google StreetView car can now map a city’s air pollution levels as well. For the last year, Google strapped air pollution sensors onto their iconic StreetView cars and drove around Oakland, CA in a study measuring air pollution rates caused by vehicle exhaust.
The project was conducted in partnership with the Environmental Defense Fund (EDF) and Aclima – a pollution sensor startup that provided the sensors installed on the StreetView cars. The equipment took nearly 3 million measurements and covered 14,000 miles in the course of a year. They measured for nitric oxide (NO), nitrogen dioxide (NO2) and black carbon – all pollutants from car exhaust – at multiple times in the day. The results are one of the largest air quality datasets ever published.
“Air pollution varies over space and time,” said Karin Tuxen-Bettman, Program Manager of Google Earth Outreach, in a video interview. “So mapping all of Oakland at different times of the day and different times of the week allows us to paint a more high resolution picture of the air pollution on the ground. Essentially making the invisible visible.”
![Annual median daytime concentrations for 30 m-length road segments based on 1 year of repeated driving for a 16 km2 domain in West Oakland [WO] and Downtown](http://fanvive.com/wp-content/uploads/2017/06/west_oakland.jpeg)
“The information could one day play a significant role for city planners thinking about where to zone residential neighborhoods or build public facilities like playgrounds and parks.”
What’s most interesting about the data is it can even show you variation in pollution levels inside one city block. One side of the block could see substantially higher levels of pollution just from lying closer to a highway. The information could one day play a significant role for city planners thinking about where to zone residential neighborhoods or build public facilities like playgrounds and parks.
West Oakland is bordered on all sides by freeways, busy thoroughfares, and a major port. Residents have long suspected the heavy traffic and industrial output may be polluting the air and impacting people’s health. Now residents have this data in their hands to help them push for better urban planning decisions.
“You always have to have concrete evidence. The hard data always gives you an upper hand,” said Margaret Gordon, Co-Director of the West Oakland Environmental Indicators Project.


